Smart Dashboard & Report Analysis
Turn your business data into meaningful insights with simple AI prompts. Create customized dashboards and reports for different applications using CK Tech Solutions.
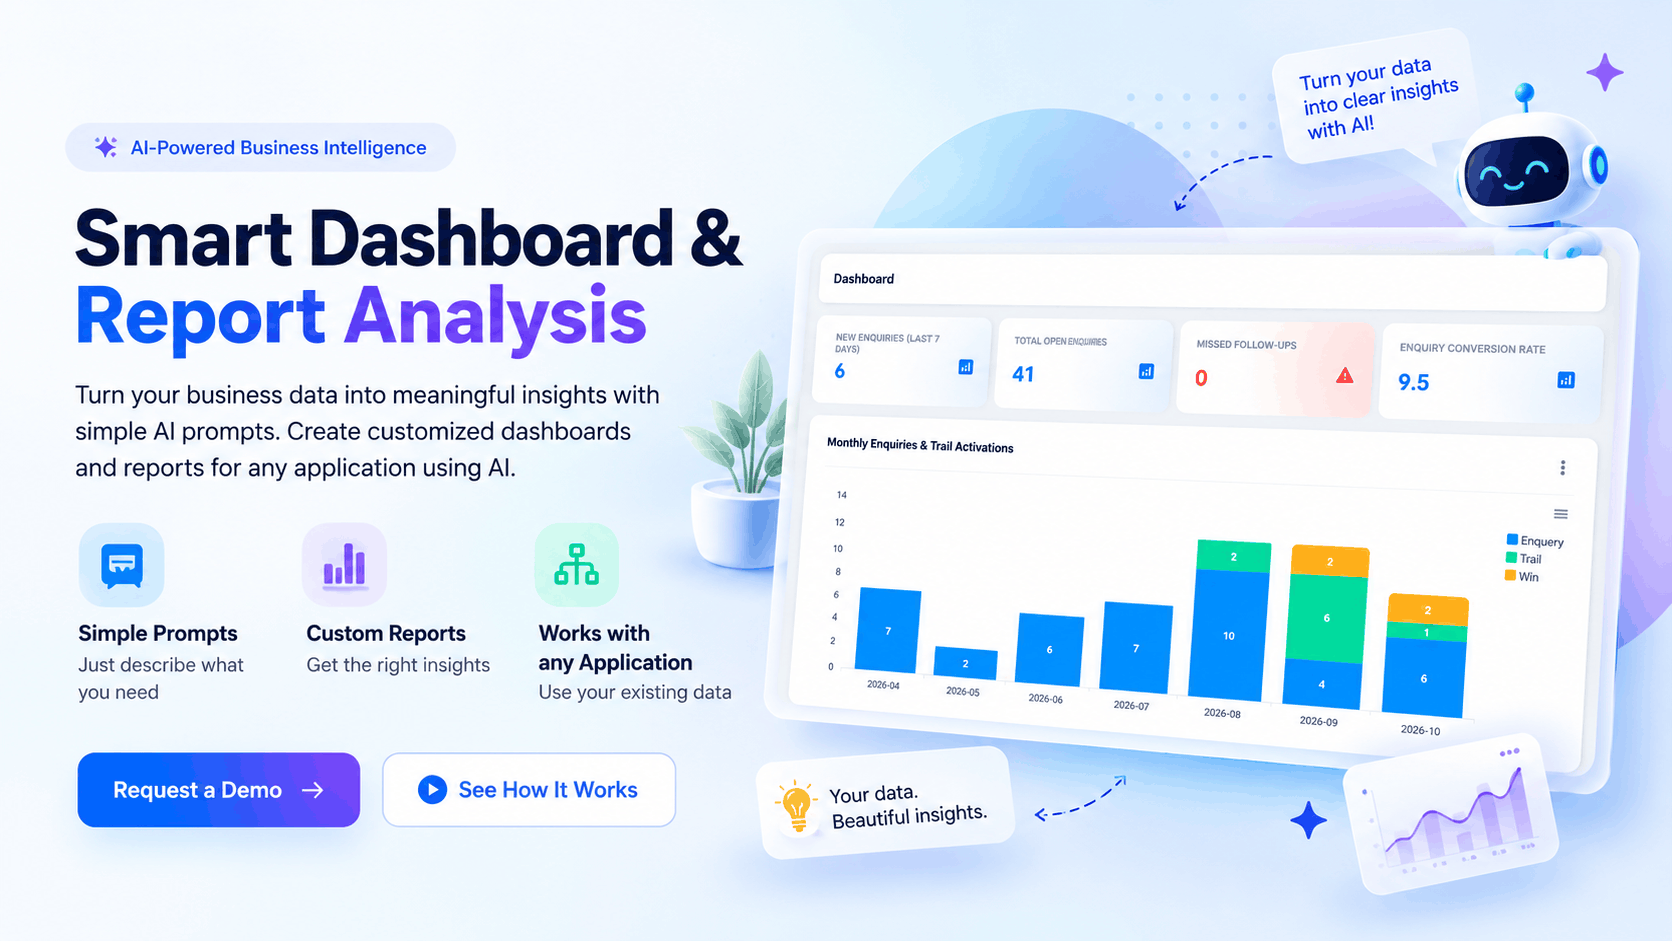
What Is Smart Dashboard & AI Report Analysis?
Smart Dashboard & AI Report Analysis is an AI-powered solution that helps businesses create customized dashboards and reports using available application data.
Instead of manually arranging every chart or report, users can describe the information they need in simple language. The solution can help turn those requests into visual reports based on supported features, data sources, and integrations.
Save Time
Reduce manual effort in dashboard creation.
Easy to Use
Describe your requirements in simple English.
Better Insights
Understand business data through visual reports.
Flexible Reporting
Explore reporting for supported applications.
Everything You Need for Smarter Reporting
Explore a flexible way to create dashboards, analyze business information, and understand important performance metrics.
AI-Powered Dashboard Creation
Describe the dashboard you need using a simple prompt. Let the configured AI solution help create a suitable view from available data.
Smart Report Generation
Create organized reports to review important figures, trends, and business performance.
Different Application Integrations
Explore dashboard connections with different applications through compatible APIs and data sources.
Visual Data Analysis
Make information easier to understand using charts, graphs, tables, and other supported visual elements.
Business KPI Monitoring
Track metrics such as sales, revenue, enquiries, customer activity, and pending tasks.
Custom Business Reports
Explore reporting layouts based on your business requirements, application data, and workflows.
Your Complete Business Overview in One Dashboard
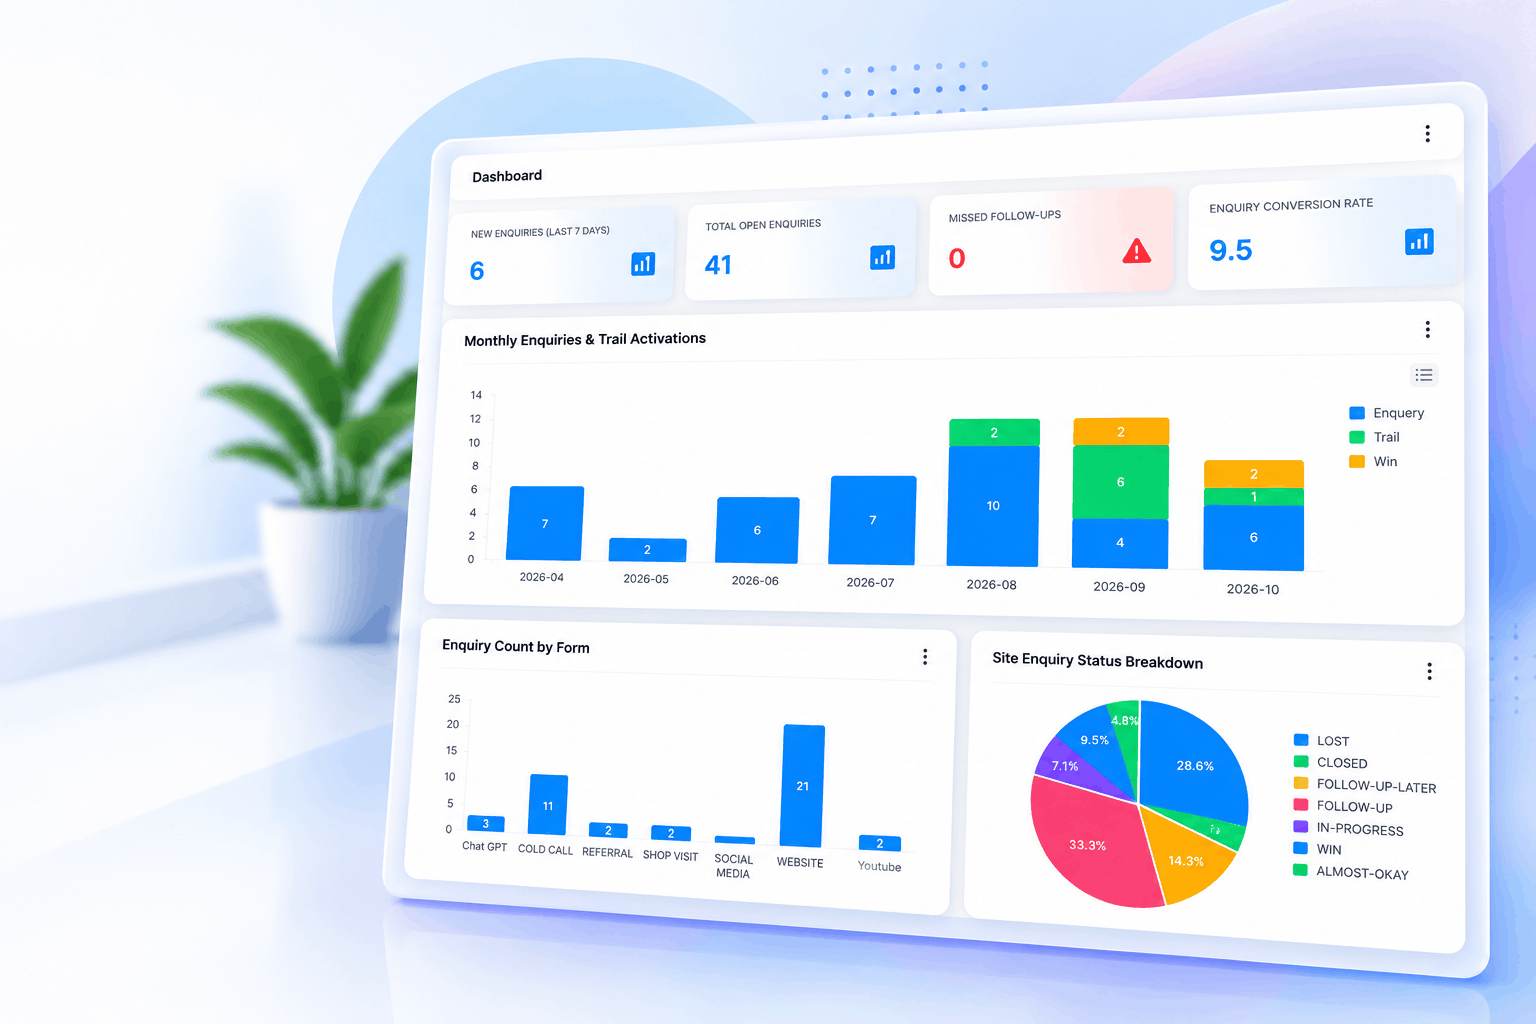
Bring important business metrics together in one place. The example below shows enquiry tracking, follow-up indicators, conversion rates, and monthly activity.
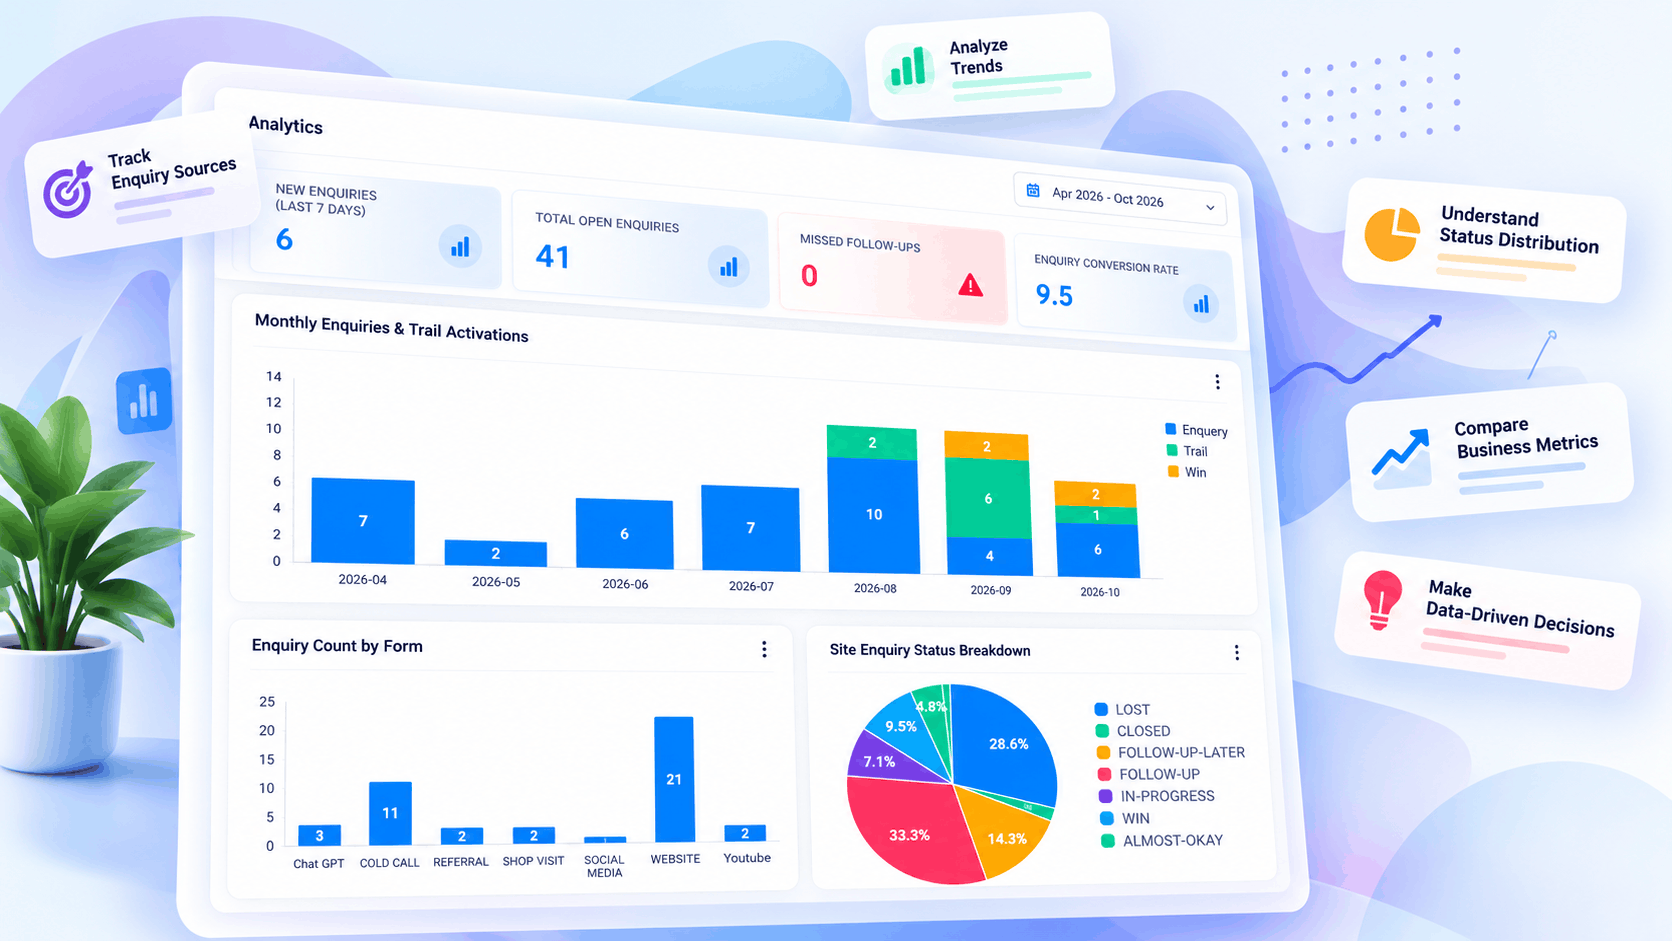
Understand Your Data from Different Perspectives
Visual reports help you understand where enquiries originate and how they move through different stages. Use similar reporting approaches to explore other supported business metrics and application data.
Just Describe What You Need
Create dashboards and reports using simple English prompts instead of manually describing every chart and report layout.
"Create a monthly sales dashboard with total revenue."
"Show customer growth for the last six months."
"Display pending orders and completed orders."
"Create a dashboard for employee performance."
"Show monthly expenses and profit trends."
"Compare performance across different business periods."
Examples are illustrative. Generated dashboards depend on available data, integrations, and configured product features.
Create Your Dashboard in Simple Steps
Explore a straightforward approach to creating custom dashboards and reports for your application.
Connect Your Data
Configure your application or data source with the required permissions and integration.
Enter a Simple Prompt
Describe the dashboard or report you want using simple language.
Generate the Dashboard
Use the AI-assisted system to create a suitable dashboard based on supported data.
Review and Use
Verify the results, customize the report, and use the insights to support decisions.
AI Dashboard Solutions for Different Industries
Explore reporting possibilities across different departments and business applications, based on available data.
Sales & Marketing
Track enquiries, lead conversions, revenue, and marketing performance.
Finance & Accounting
Review income, expenses, outstanding payments, and financial summaries.
Retail & E-Commerce
Analyze product sales, orders, inventory, and customer purchasing trends.
Customer Management
Understand customer activity, follow-ups, and service performance.
Human Resources
Review recruitment, attendance summaries, and employee performance where supported.
Business Operations
Monitor operational metrics, pending activities, and management reports.
Why Choose CK Tech Solutions?
CK Tech Solutions develops software and digital solutions to help businesses simplify their operations. Our Smart Dashboard & AI Report Analysis product focuses on flexible, AI-assisted reporting for different business needs.
From management dashboards to custom application reports, we help you explore an approach that fits your reporting requirements and available data.
Smart Dashboard & AI Report Analysis FAQs
Learn how AI dashboard software can support your reporting and business analysis requirements.
Build Smarter Dashboards with AI
Tell CK Tech Solutions about your application and reporting requirements. Explore how AI-assisted dashboards can help your business turn available data into meaningful insights.