Pawn Broking Reports, Dashboards & Business Analytics
FinApp gives pawn brokers more than 20 standard reports, business dashboards, master-wise summaries, visual charts and multiple export formats so you can understand your shop's position without depending on manual report preparation.
Every grid can show summary totals, helping you understand key figures before generating or exporting a detailed report.
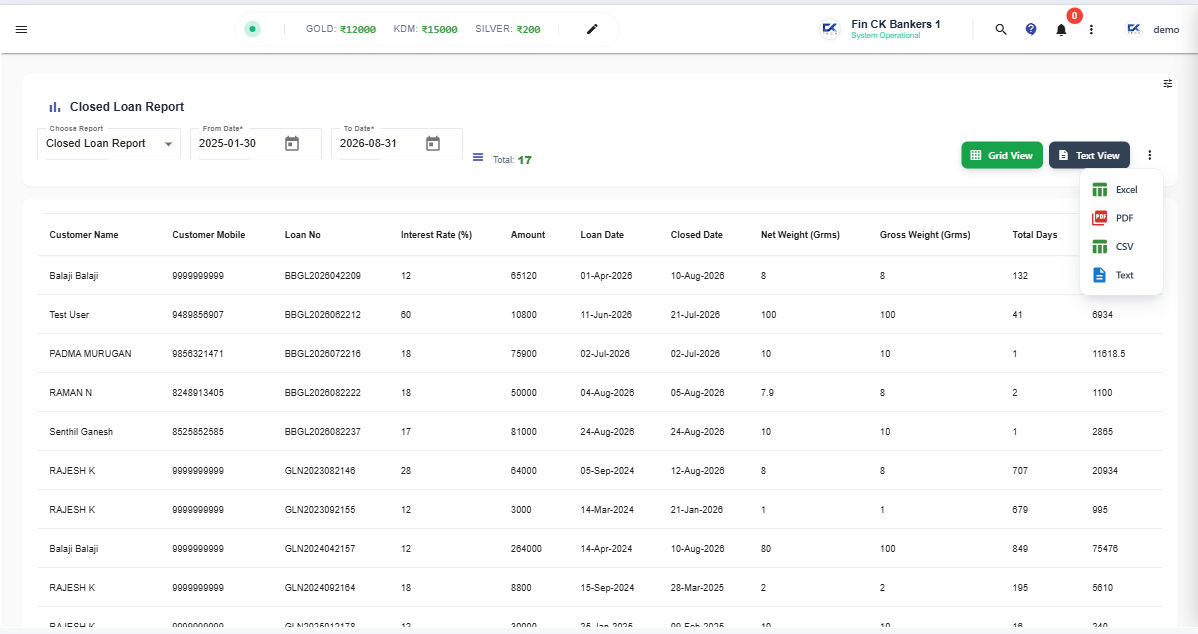
What Can You Analyse with FinApp Reports?
FinApp combines standard reports, dashboards and grid-level summaries to help pawn brokers analyse customers, loans, collections and business performance.
Customer Performance
Analyse customer-related activity, loan relationships and relevant customer performance information.
Loan Performance
Review loan activity, outstanding amounts and other operational loan performance indicators.
Future Collections
View future outstanding collections and understand amounts expected from active loan accounts.
Master-Wise Totals
Grid pages provide quick summary totals so important figures can be reviewed without running a separate report.
Custom Reports
Additional reporting requirements can be handled through custom reports based on the business need.
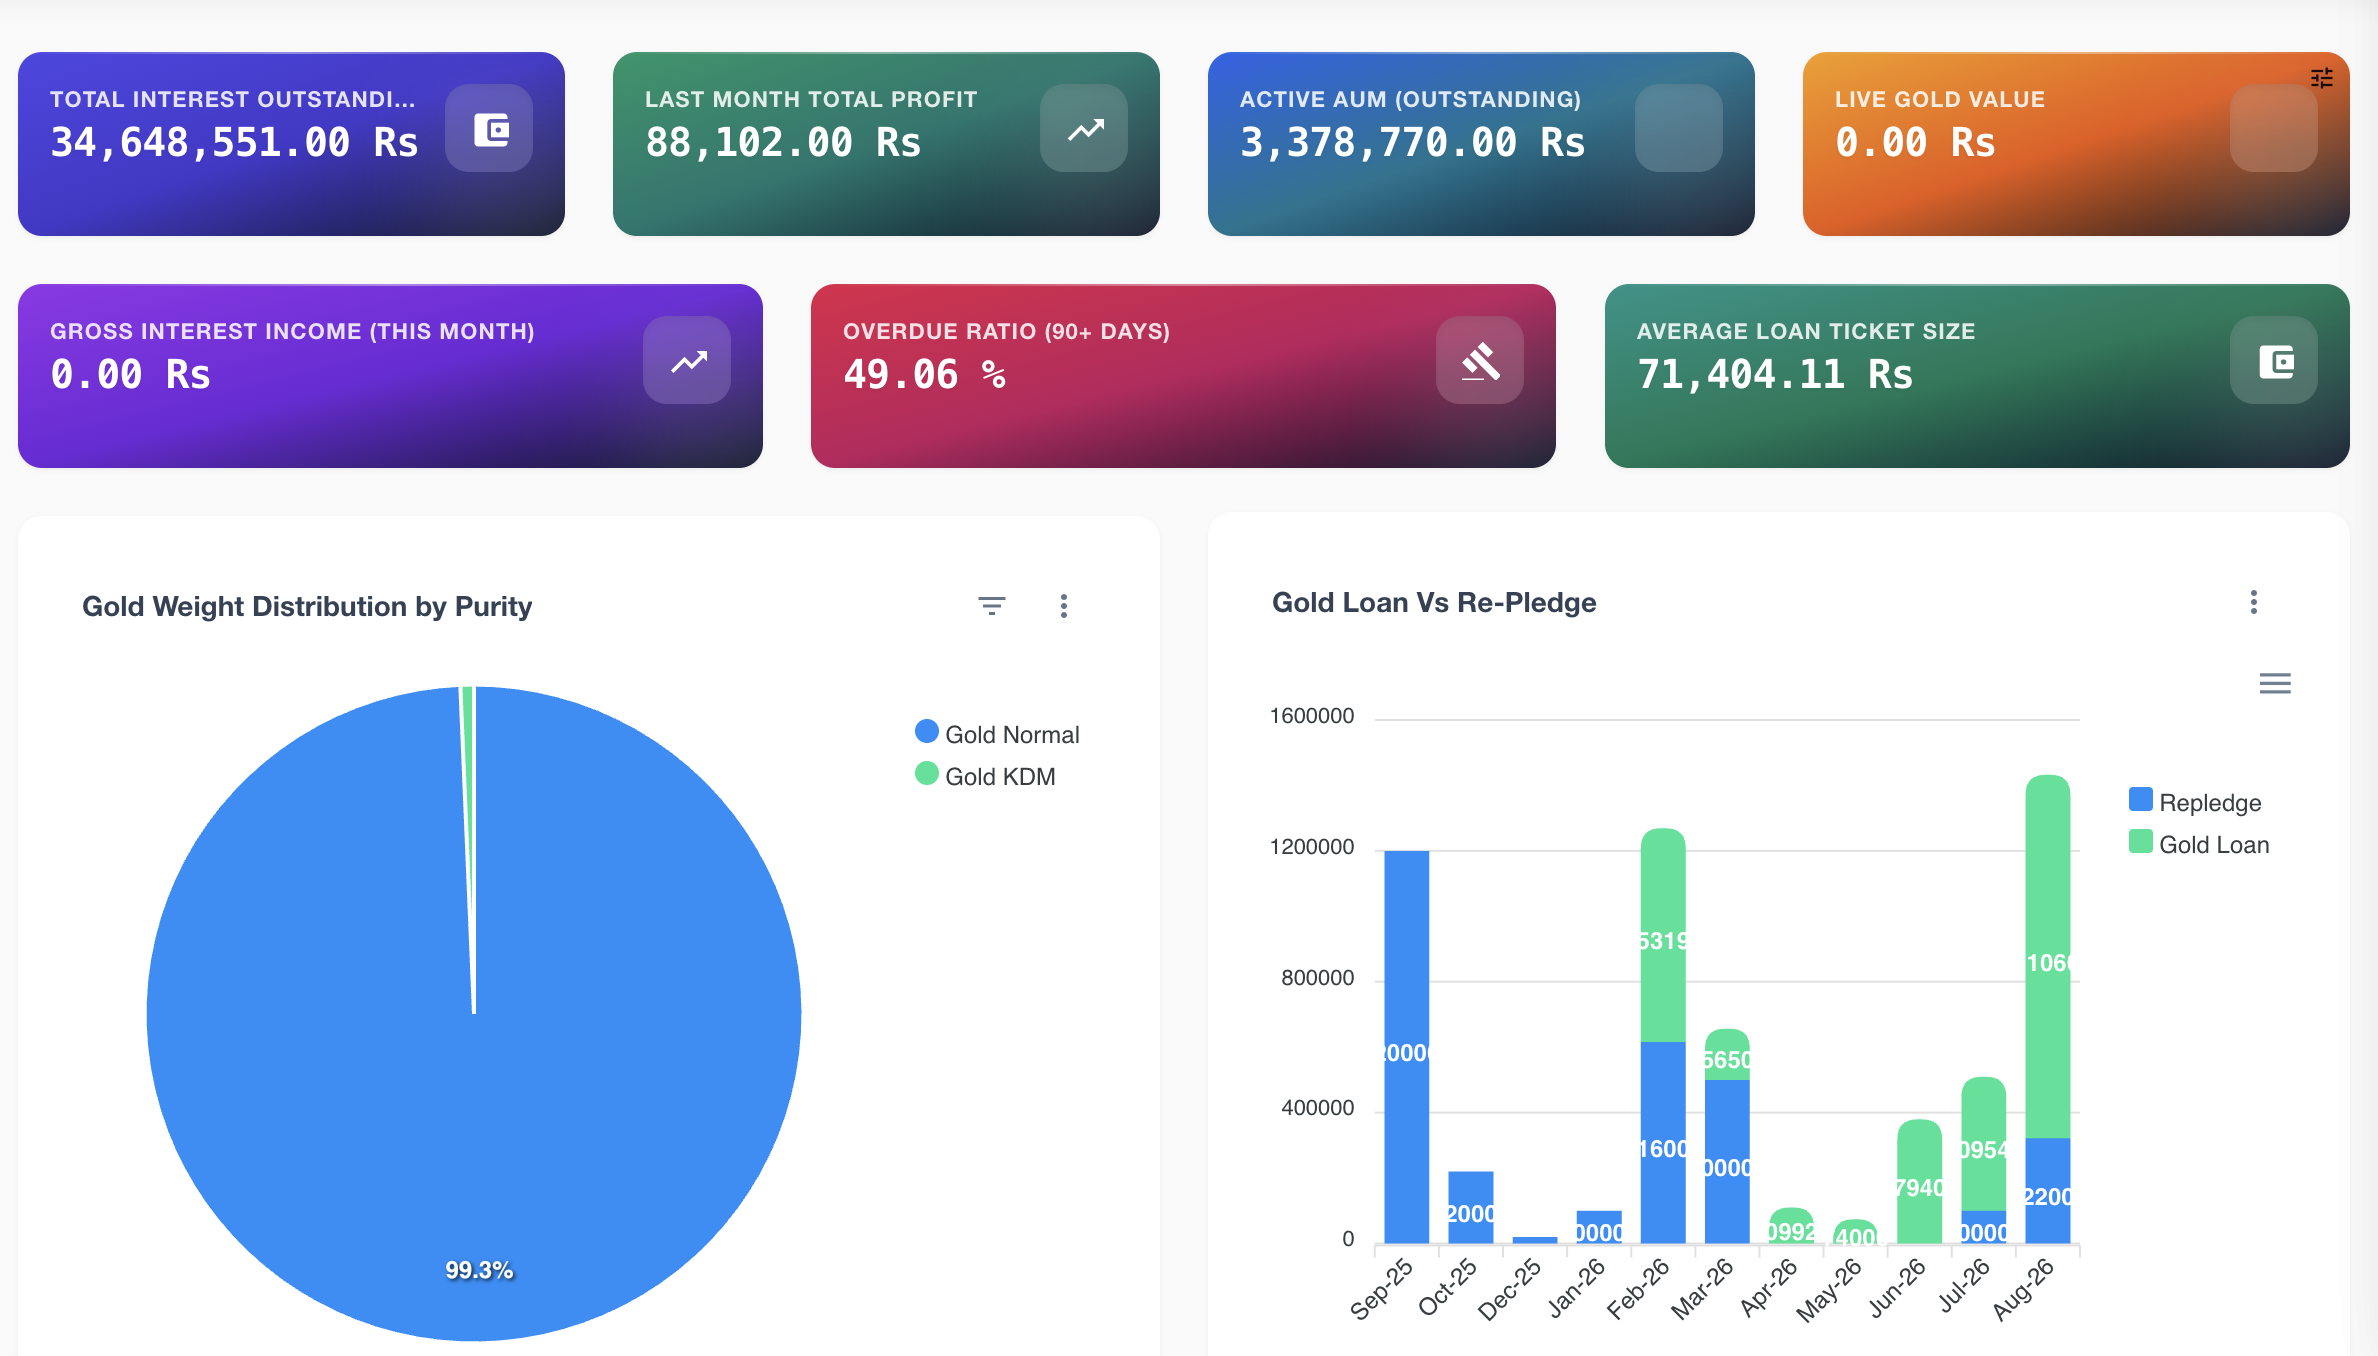
Business Dashboards
Bring important business indicators together in dashboards for a quick operational view.
Turn Pawn Business Data into Visual Insights
FinApp can present business information through different visualisation formats so trends, comparisons and performance indicators are easier to understand.
Export Reports in the Format Your Business Needs
Download report and transaction data in commonly used formats for analysis, sharing, printing and accounting workflows.
FinApp → Accounts
Send Transactions to Tally and Excel Without Re-Entering Them
FinApp helps keep operational transactions connected with your accounting workflow. Export transactions to Tally and Excel while tracking bank transactions alongside cash, reducing duplicate data entry for your accounts team.
Tally Export
Export supported transactions for continued accounting work in Tally.
Excel Export
Take transaction data into Excel for additional analysis or accounting workflows.
Cash & Bank Tracking
Track bank transactions alongside cash movements for a clearer financial position.
Get the Business Position Before You Need a Report
FinApp combines dashboards, grid summaries, reports and visual analytics so owners and managers can review business performance without waiting for month-end manual calculations.
Explore Other FinApp Features
Discover more features to simplify your pawn broking operations.
Pawn Broking Software Across Tamil Nadu
Explore FinApp in major locations across Tamil Nadu.
Pawn broking software in Tamil NaduQuestions About Pawn Broking Reports & Analytics
Staff and Admin Dashboards With a Risk View
Each role starts the day with what it needs to see.
A dashboard for every staff member
Staff see the loans created today, their own performance, and pending actions such as the maturing loan list and the overdue list for follow-up.
A full overview for the admin
Admins see the pledge and loan overview, the repledge ratio and the defaulters list in one place.
Risk view
The risk option compares the value of the gold today with the amount sanctioned plus interest, so the admin can react early. Loan search can filter by risk slab, and vehicle and property loans show a loan-to-value badge: green below 70%, amber from 70% to 80%, red above 80%.
Dashboards you can rearrange
Dashboards are built from widgets and can be customised. By default only Super Admins can change the layout, and a company can allow its admins to do it with a setting.